Is there an index that isn't a 'consumer price index' but a 'cost of living index' instead then? An index that includes the basics of life like food, energy costs, shelter, transport, education, healthcare and some basic consumer goods? I think the issue most have with CPI is it's often sold as a cost of living index by media, politicians and policy makers and it makes people feel unheard as a result.
"My cost of living has doubled but your saying everything is fine since the CPI has only gone up %3!!!" and general 'let them eat cake' style behaviors saying that iPads are 'so much cheaper'[0] is the general feeling I get.
I’ve always wanted to see this + I would love to see two Versions of this, one for a 25th percentile earner, and another for 75th percentile. E.g a) what it costs to rent a modest apartment, drive a Honda Civic, shop at Walmart, have 2.5 kids in public school etc. and B) own a home in a metro area, drive an entry level luxury car, shop at Whole Foods, send kids to private college etc.
It’s my perception that there is not much inflation in some areas of the market (chicken thighs at Kroger) and tons for the “keeping up with the Jones’s” set (organic produce, private school education etc)
My point being that inflation can be quite different based on different baskets of goods / consumption patterns
People constantly cite that CPI excludes things like housing costs, or if we probably dug into it more excludes stuff in strange ways. It's also probably a global thing, some countries do exclude it completely, others do not so it can confuse things:
The CPI does include housing. And my citation for that is the Bureau of Labor Statistics, whose job is to put it together. Here is the document with excruciating detail:
Housing is 42.385%, of which the shelter itself is 33.316%. The rest includes things like "Clocks, lamps, and decorator items" at 0.313%.
That's American data. Maybe the Australian data (your first link) really does exclude it, but the US most certainly does not.
If people think that the basket of goods is skewed, they need to justify that by comparing it against this list. The BLS makes a ton of data available, and it's unreasonable to claim otherwise.
> general 'let them eat cake' style behaviors saying that iPads are 'so much cheaper'
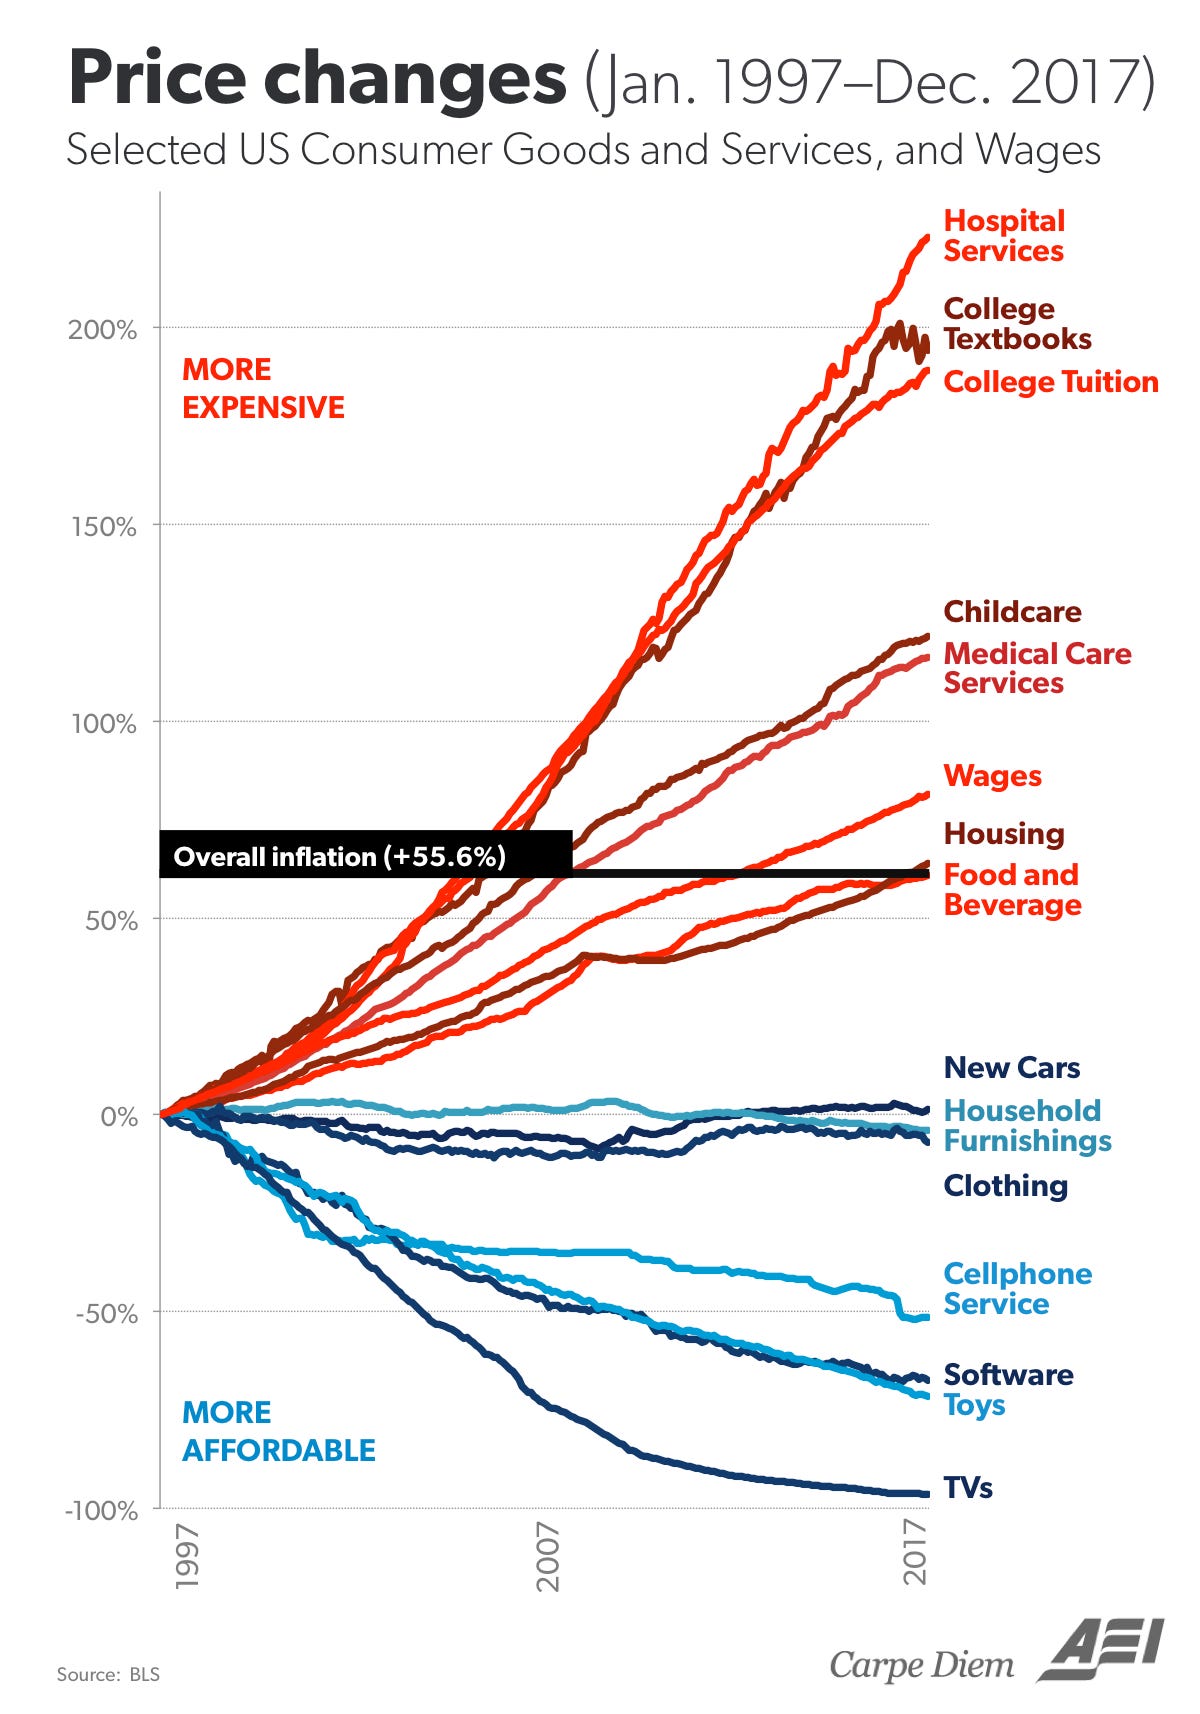
This is a good visualisation of which things got cheaper and others got more expensive, over the last 20 years in the USA. It shows how a "consumer price index" in which, for example, the price of tobacco is weighted at >50% the price of education, can make it seem like it's all okay.
1. The current BLS weights for Education is 3.033%, for Tobacco and smoking products 0.608%, that's 20%, not >50% [1].
2. There are around 20mln Americans in college, versus around 34mln adult smokers. Be careful about peer-group bias: how many of your friends smoke, how many went to college?
It seems like for TVs, it's more that you get a better TV for your money, not that people are spending less on them? A cursory Google search suggests $500-$1,000 was the norm in the 90s, and that seems to be about what people are spending these days too. I can find a nice 24 inch one for $100, but I expect you could find cheaper TVs in the 90s too.
That is a wonderful and very telling graph. Also interesting to note that everything that has becomes cheaper is optional spend (except clothing) that one can do without. Everything above the line which has become more expensive are things which are more necessary.
Maybe the Libertarian in me is coming out when I look at that chart, but it sure seems that the sectors of the economy that increased in price the most are also the most regulated and subsidized.
Without delving into the data, wouldn’t a plausible explanation be that we regulate and/or subsidize those industries _because_ they are the most inflationary? Industries with downward price trends don’t often need consumer protections.
The counter argument is prices come down with increased supply and competition-driven innovation. Regulation inhibits supply. How would regulation make them less inflationary?
"My cost of living has doubled but your saying everything is fine since the CPI has only gone up %3!!!" and general 'let them eat cake' style behaviors saying that iPads are 'so much cheaper'[0] is the general feeling I get.
[0] https://www.reuters.com/article/us-usa-fed-dudley-ipad/ipad-...